The simpler, the better: Metrics that matter for Product Listings


As a borderline data fanatic, I’ve often been guilty of going way too deep and into the weeds to try to analyze every single eCommerce metric available to improve sales. Over the years I found out that while improving a metric can be very difficult, figuring out what you need to improve should be pretty simple.
That’s why I’ve put together a list of the five most important metrics to look at when analyzing your product listings and identifying areas for improvement. The way the list works is a funnel, when you have one step down, you can proceed to the next one, but otherwise, focus on the current metric at hand that needs to be improved.
Metrics that matter for Product Listings
Step 1: Analyze Organic/Paid Search Traffic
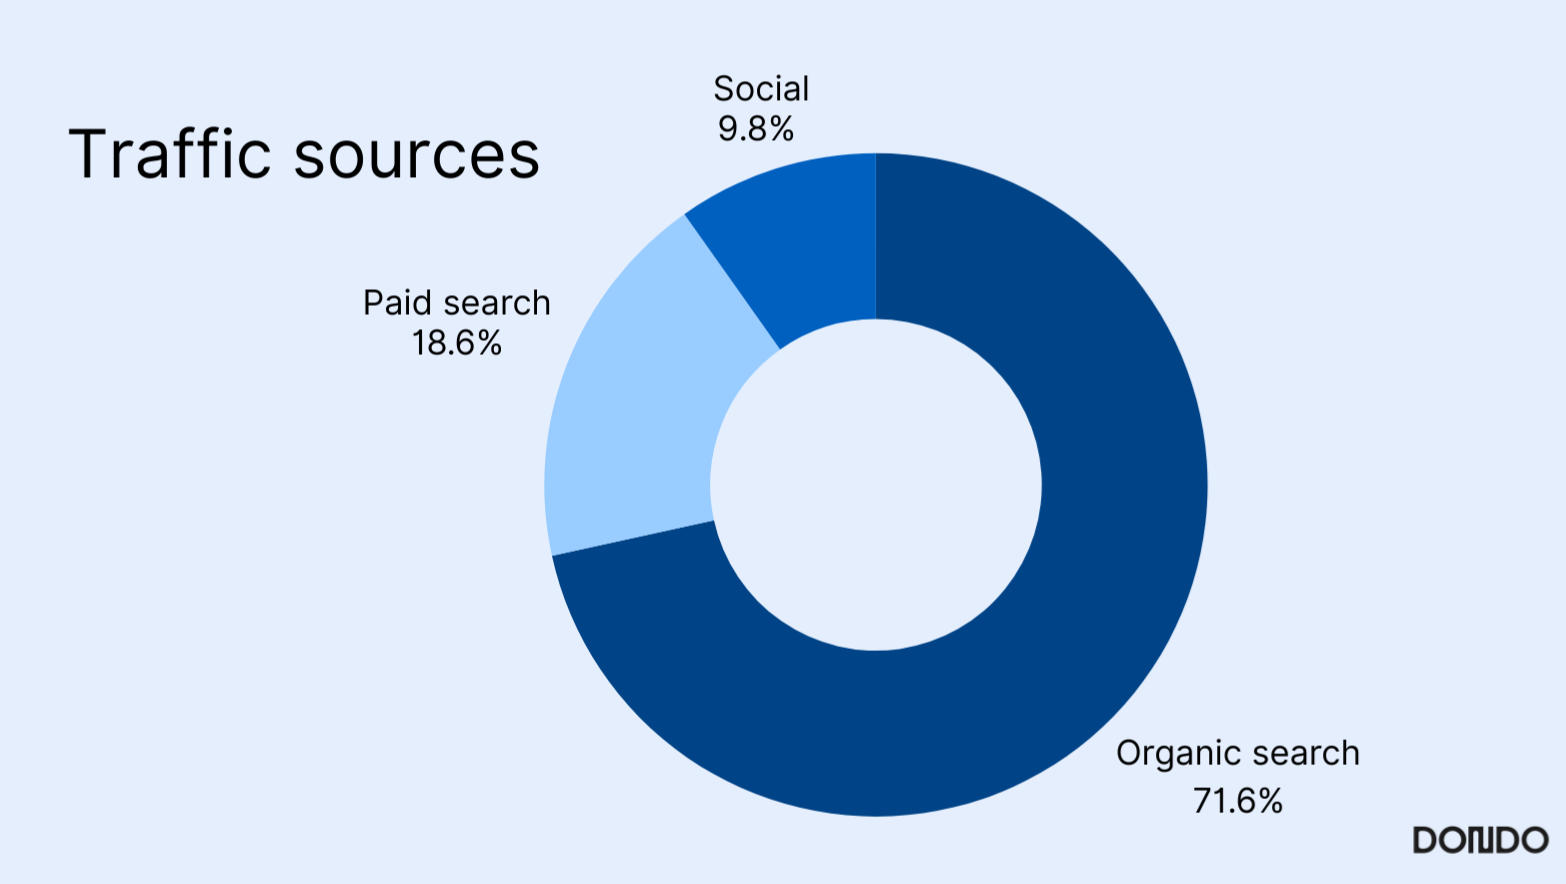
While somewhat obvious, no product listing is going to sell if it’s not being seen by potential customers. Organic search traffic indicates how many visitors land on your product pages through unpaid search results. This metric reflects the effectiveness of your product page SEO (Search Engine Optimization), which is highly dependent on your metadata and having up-to-date keywords (the more trendy the better).
While it’s best to not rely heavily on paid traffic, SEO work often takes up to 3-6 months to show visible effects, which is why it’s a good rule of thumb to spend some ad dollars targeting your audience early on. Expected costs vary based on country and industry, but the most important metric to watch is your cost per thousand impressions (CPM). If your CPM is cheaper than your industry/regional average, you’re on the right track (the lower the better).
Step 2: Analyze Click-Through Rate (CTR)
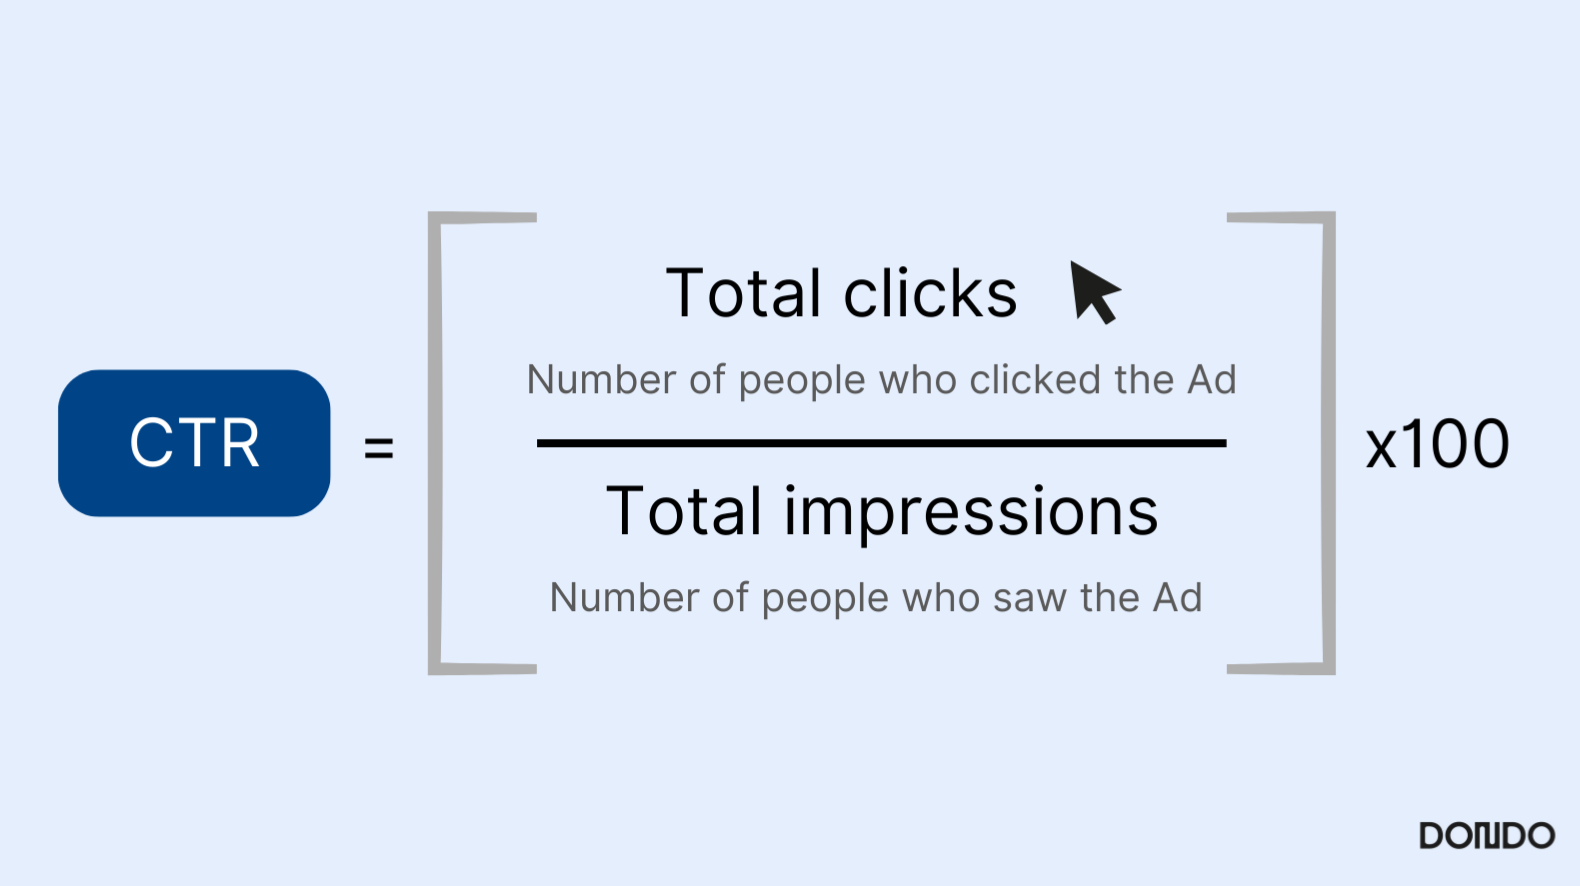
Your CTR measures the percentage of people that clicked on your product after seeing it in the search results (applicable for both paid and organic traffic and any product in your store). A high CTR indicates that your product title, description-snippet, and visuals are compelling.
While Google SERP (Search Engine Results Page) visibility affects how often your listing is seen, it’s your listing’s content—titles, images, and meta descriptions—that influences CTR. Industry average CTRs vary widely, but if you’re above 2-3% for paid ads and well higher for organic traffic you can start moving forward to the following steps.
Step 3: Analyze Bounce Rate
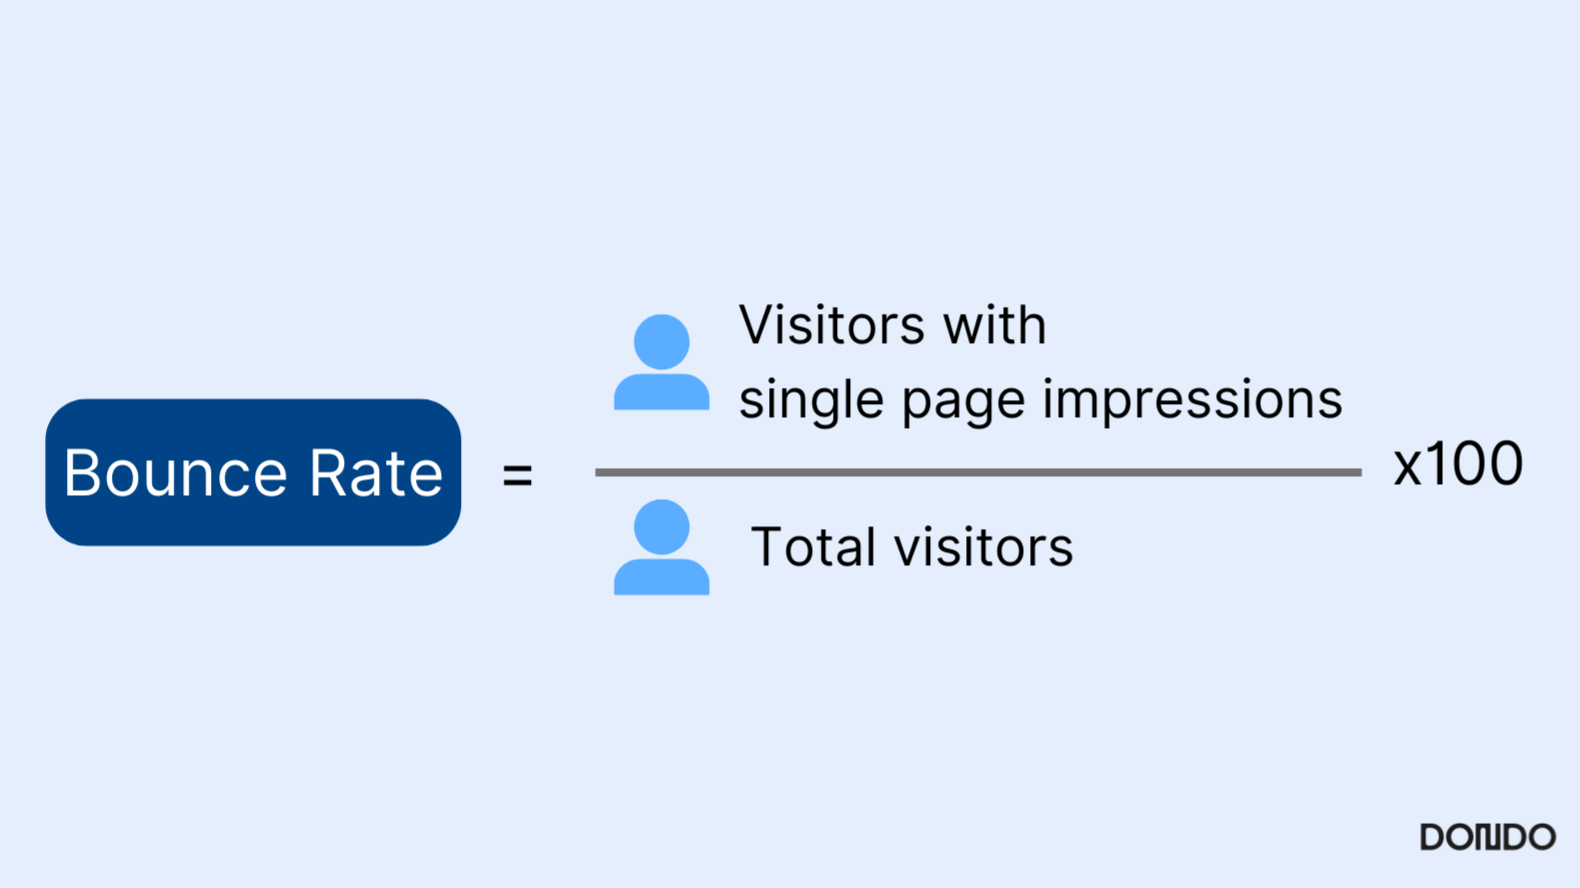
Bounce rate shows the percentage of visitors who leave your site without engaging further after arriving. A high bounce rate can signal many issues, such as slow page speed, irrelevant content, or a poor user experience. A common mistake is incorrect linking, where the product listing being clicked on isn’t the page users end up on, causing confusion and quick exits (aka the ‘bounce’).
While not purely an SEO issue, technical SEO audits can uncover site performance problems that indirectly affect bounce rates, like load speed and linking. Bounce rates vary drastically across verticals (and page types) but a good goal is to shoot for a bounce rate of below 50%.
Step 4: Analyze Conversion Rate
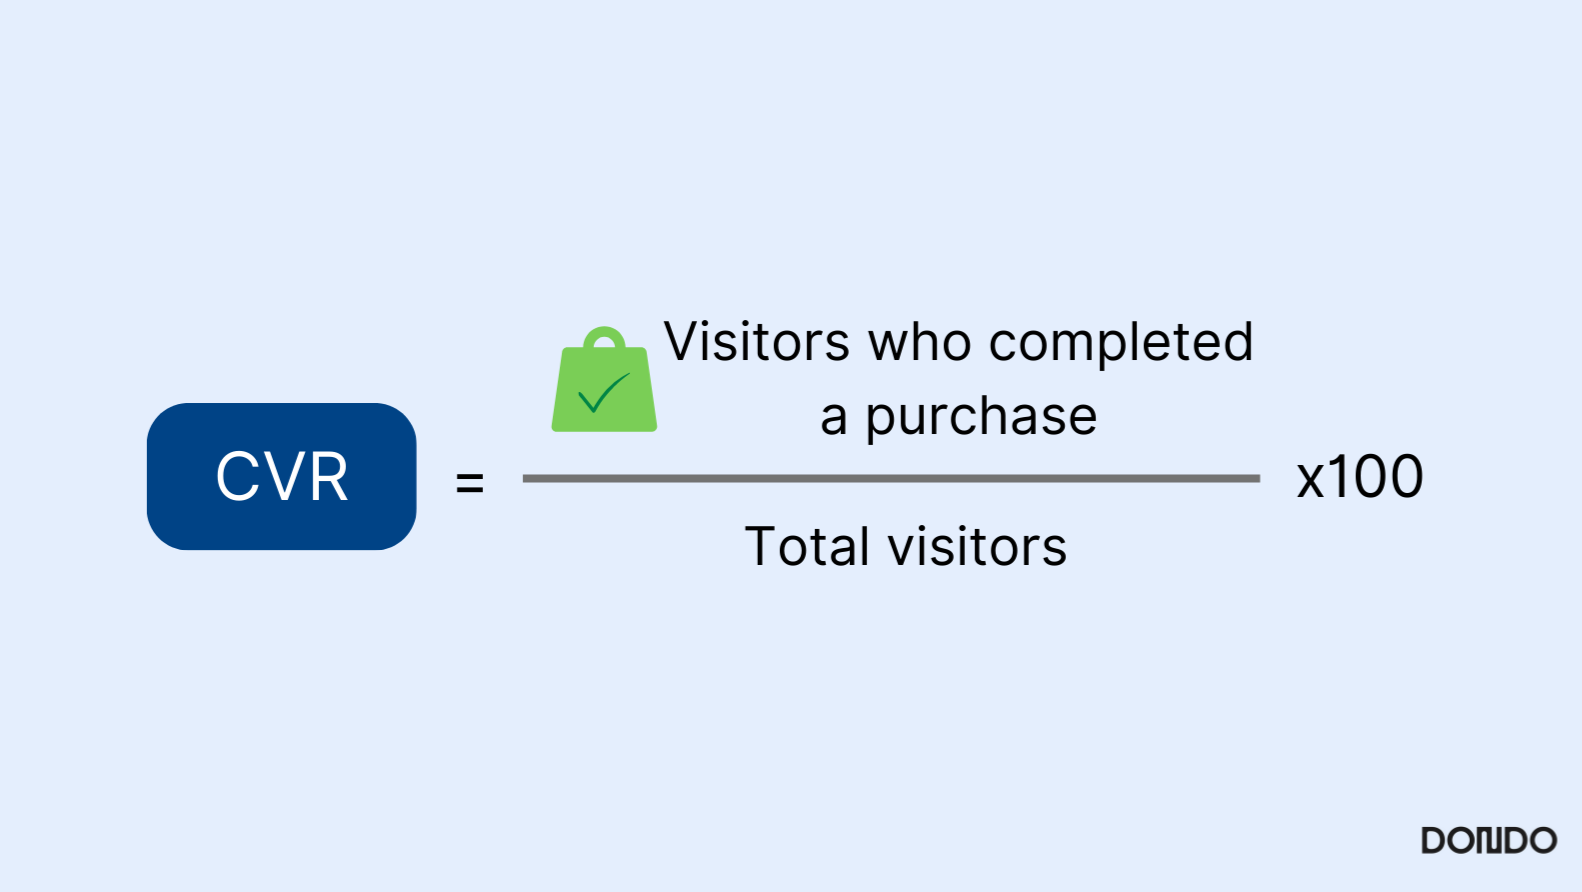
Your conversion rate reveals the percentage of visitors who complete a purchase after viewing your product. In my opinion, this is the most important metric of all as it is the largest opportunity to be improved; a good conversion rate is only 2-5% which means that if you can do better than getting one out of every twenty people that are already interested in your product to buy it, you are crushing it.
Improving a conversion rate has to do with optimizing the entirety of a listing: ensuring you have great images that showcase your product well, an informative and detailed description of your product, formatting that adds trust, a clear call-to-action that will help drive purchase intent (e.g. buy now! or sale until! etc), and other factors. Doing that work manually is ridiculously time-consuming (speaking from experience) and challenging but conversion rate optimization software can help lessen the load.
Step 5: Analyze Average Order Value (AOV)
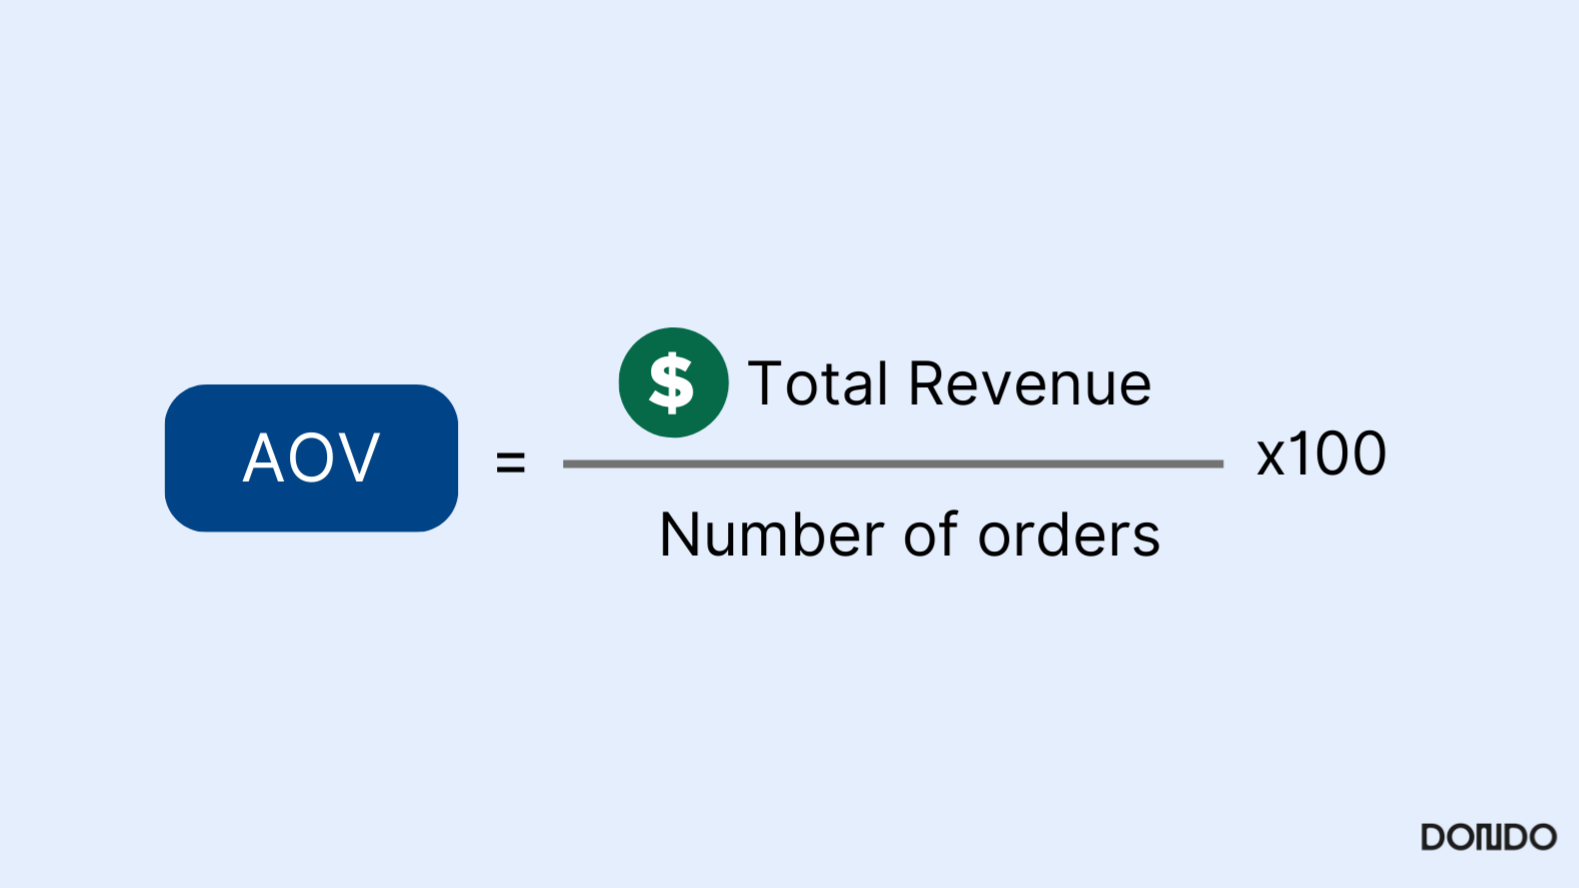
AOV tracks the average amount spent per transaction. This helps you understand customer purchasing behavior and identify revenue growth opportunities through cross-selling, upselling, or bundling products.
While your AOV is very important, it’s more relevant for overall business health when compared to your costs and is more valuable for long term projections than instant analysis. That being said, AOV provides quick insights into how well your listings encourage additional purchases.
An Easier Solution
Analyzing and improving your listings can feel daunting at times, but by using AI solutions like Dondo it doesn’t have to be overwhelming.
Dondo helps you analyze your listing performance by letting you upload as many products or stores as you want and providing detailed score reports that show what’s working and what needs improvement—covering SEO, descriptions, CTAs, images, titles, keywords, and more. While that analysis provides a base, with Dondo you don’t have to stress about manual improvements either, our platform can automatically optimize every product in your inventory and post it directly to your store.
Try it out today for free or if you’re curious to see how it works, feel free to reach out at parker@dondo.com.
